
Environment
Asia-Pacific airlines 'greener than rivals'
A new report released last month analyses the carbon footprint of aviation across the globe listing the highest emitting airlines, airports and countries.
June 1st 2013
The Asia-Pacific may be the world’s fastest growing aviation sector, but when it comes to CO2 emissions its airlines are a long way behind their counterparts in Europe and the U.S., according to a new report analyzing the industry’s carbon footprint last year. Read More »
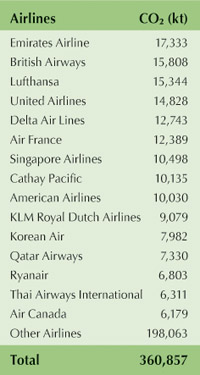
The highest emitting airline in the world? Emirates Airline with a touch over 17 million tonnes, according to the report, Aviation Carbon Footprint - Global Scheduled International Passenger Flights 2012.
Authored by aviation carbon footprinting expert, Dave Southgate, it says the Gulf major is followed by British Airways with 15.8 million tonnes, Lufthansa German Airlines with 15.3 million tonnes and United Airlines with 14.8 million tonnes.
The first Asian carrier to feature is Singapore Airlines in seventh place with 10.5 million tonnes, followed by Cathay Pacific Airways with 10.1 million tonnes.
The report, which has been published in book form, is to be used as a data resource to assist deliberations at the International Civil Aviation Organization (ICAO) as it seeks options for addressing the issue of market-based measures (MBMs) for aviation’s emissions.
Southgate is a former Australian government transport official. From 2004, until his retirement last year, he was the Australian government representative on ICAO’s Committee on Aviation Environmental Protection (CAEP).
 |
The report is the most detailed study ever done on aviation’s global carbon footprint. It shows:
• the airport with the highest CO2 footprint, some 16.4 million tonnes, is London Heathrow.
• the country with the highest carbon footprint is the U.S. with nearly 50 million tonnes.
• the city-pair route with the highest emissions is London to Singapore.
• measuring footprint by aircraft type, the B777 tops the list, notching up 23% of total emissions, followed by the A330, the A320 and the B737.
In terms of regions, Southgate found that 36% of CO2 emissions can be attributed to Europe, 29% to the Asia-Pacific, 19% to North and Central America, 8% to the Middle East with the remainder shared between South America and Africa.
He drew from a number of sources in compiling the information, including data supplied by Innovata. Flight-by-flight carbon footprints have been computed using a great circle computational tool developed by the Australian government’s Department of Infrastructure and Transport. The algorithms in the tool are based on those contained in the ICAO Carbon Calculator.
Global – international and domestic – carbon emissions from aviation in 2012 were estimated by IATA to be 667 million tones, but ICAO is tasked with regulating only international emissions, which make up around 62% of the global total.
Southgate calculated the emissions from scheduled international passenger operations to be around 80% of the total carbon footprint of international aircraft operations, or approximately 360 million tonnes.
He said there were significant gaps in solid data available and has therefore been restricted to assessments based on international scheduled passenger operations, albeit by far the largest traffic segment. The reported carbon data is based on computations.
“If there is to be an effective response to climate change, decision-makers need to be provided with information they can understand and trust,” said Southgate in his report.
“If there is to be public support for those decisions, members of the public need to be in a position that enables them to understand why decisions have been made and to easily track whether the outcomes of decisions are achieving proclaimed goals.”
The 184-page report reveals the following facts: three of the seven ICAO regions – North & Central America, Europe and Asia/Pacific – make up about 85% of the global carbon footprint of international passenger scheduled aircraft operations.
The top 30 countries, in terms of departing operations, account for about 80% of the total and the top 50 around 90%.
The study also found there was no “dominant” airport in Asia in terms of its carbon footprint, as there is in Europe where Heathrow’s 16.4 million tonnes far outstrips the next biggest, Frankfurt and Paris, each with around 10.1 million tonnes.
In Asia, in terms of departing flights, Hong Kong with 10.4 million tonnes is closely followed by Singapore a t 9.8 million tonnes, Tokyo Narita at 8.9 million tonnes, Seoul with 7.9 million tonnes and Bangkok with 7.6 million tonnes of CO2 emissions.
